
 Coursera
Applied Plotting, Charting & Data Representation in Python
University of Michigan2.4(9 reviews)
About This Course
9 ratings Aprenda a criar visualizações eficazes em Python usando matplotlib, desde princípios de design até gráficos avançados, com foco em relatórios e representação de dados. Add to list Coursera 1 day 27 minutes Self-Paced Paid Course
Related Courses
 OtherFree
Journey into Data Science with Python
CodeSignal
5.0
 OtherFree
fast.ai: Practical Deep Learning for Coders
Jeremy Howard
4.9
 YouTubeFree
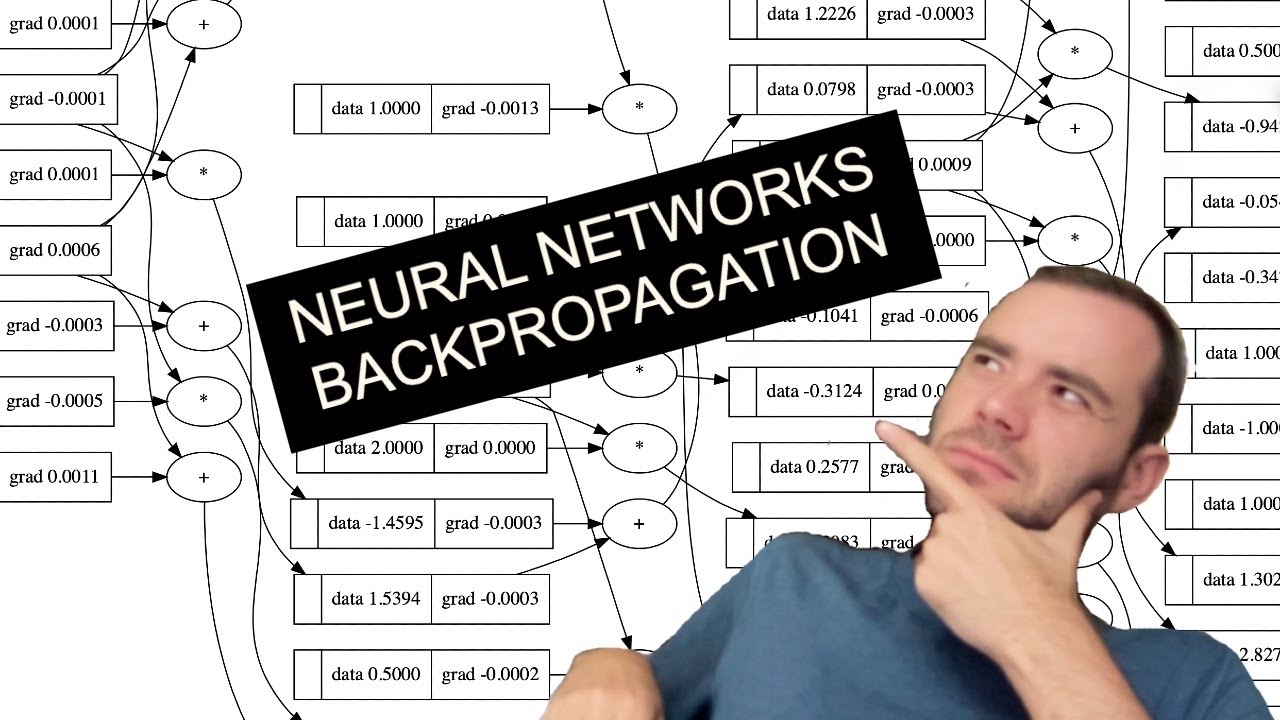
Neural Networks: Zero to Hero
Andrej Karpathy
4.9
 YouTubeFree
freeCodeCamp: Machine Learning with Python (Full Course)
freeCodeCamp
4.8
 edXPaid
CS50's Introduction to Artificial Intelligence with Python
Brian Yu
4.8
 OtherPaid
Programming for Data Science with Python
Mode
4.8
FreeJourney into Data Science with Python
CodeSignal
Other5.0
Freefast.ai: Practical Deep Learning for Coders
Jeremy Howard
Other4.9
FreeNeural Networks: Zero to Hero
Andrej Karpathy
YouTube4.9
FreefreeCodeCamp: Machine Learning with Python (Full Course)
freeCodeCamp
YouTube4.8
PaidCS50's Introduction to Artificial Intelligence with Python
Brian Yu
edX4.8
PaidProgramming for Data Science with Python
Mode
Other4.8