
 Skillshare
Data Visualization with Python: Matplotlib & Seaborn
About This Course
Master data visualization with Python. Learn to create publication-quality charts, plots, and dashboards using Matplotlib, Seaborn, and Plotly. Covers bar charts, scatter plots, heatmaps, time series, geographic maps, and interactive visualizations.
Related Courses
 Coursera$49
Google Data Analytics Professional Certificate
Google Career Certificates
4.8
 Coursera$49
Mathematics for Machine Learning and Data Science Specialization
Luis Serrano
4.7
 UdemyPaid
Data Science : Complete Data Science & Machine Learning
Udemy
5.0
 OtherFree
Journey into Data Science with Python
CodeSignal
5.0
 OtherFree
fast.ai: Practical Deep Learning for Coders
Jeremy Howard
4.9
 YouTubeFree
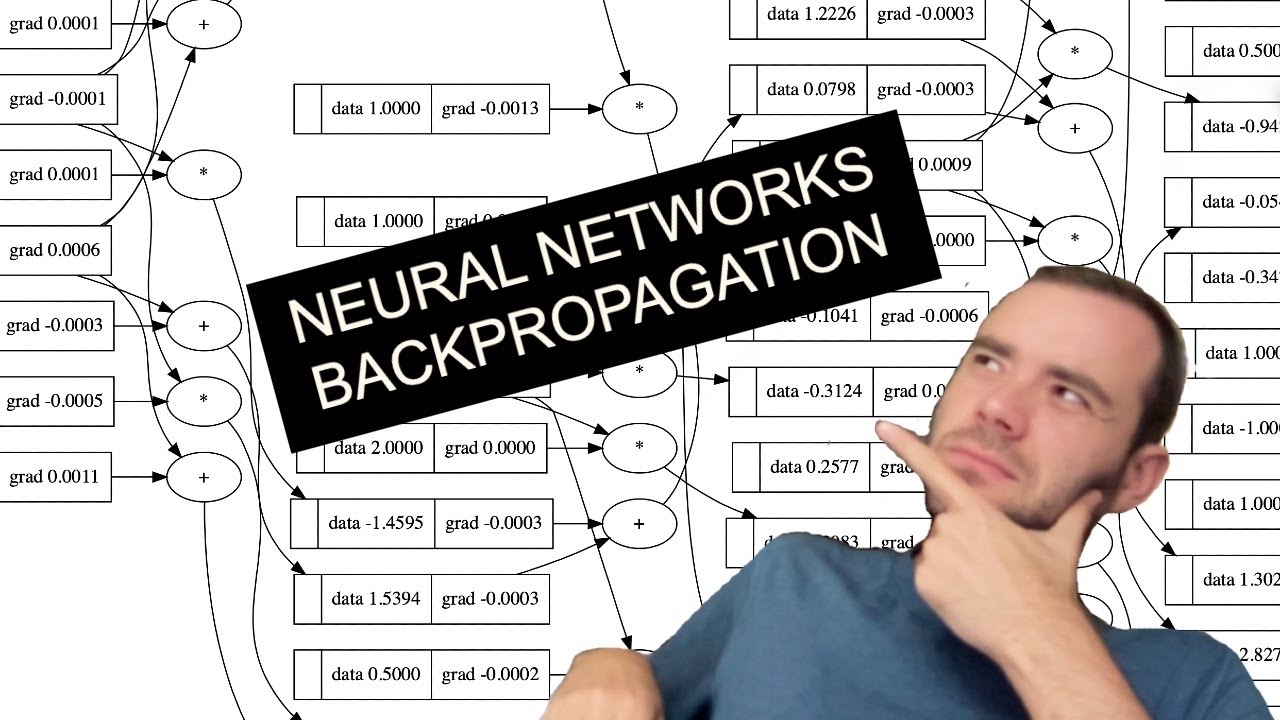
Neural Networks: Zero to Hero
Andrej Karpathy
4.9
$49Google Data Analytics Professional Certificate
Google Career Certificates
Coursera4.8
$49Mathematics for Machine Learning and Data Science Specialization
Luis Serrano
Coursera4.7
PaidData Science : Complete Data Science & Machine Learning
Udemy
Udemy5.0
FreeJourney into Data Science with Python
CodeSignal
Other5.0
Freefast.ai: Practical Deep Learning for Coders
Jeremy Howard
Other4.9
FreeNeural Networks: Zero to Hero
Andrej Karpathy
YouTube4.9